
Featured Content


Blog
Data Federation Patterns
Having seen a lot of increase in demand from my clients to start a program to create information services, I thought it might be useful to look at one way of doing that through the use of data federation software. Then I realised that it would be better to look at all the popular ways of using this technology. On that basis, this blog starts a series of blogs from me on popular patterns that companies can use to get maximum value out of the data federation software.
In order to facilitate ease of understanding, the patterns discussed have been classified into the following categories
- Business intelligence and performance management patterns
- Data warehousing patterns
- Master data patterns
- Information services patterns
- Operational patterns
- data management patterns
For those of you not sure what data federation is please refer to my 2006 article on the subject.
Performance Management Patterns
Popular business intelligence (BI) and Performance Management patterns for data Virtualization software are:
- The BI/Performance Management Integration pattern
- The Data Discovery pattern
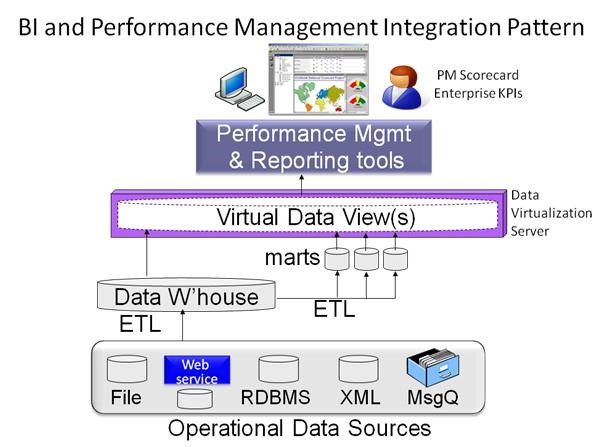
The BI/Performance Management Integration Pattern
This pattern uses data virtualization to integrate multiple underlying line of business (LoB) BI systems with performance management enterprise level scorecards and dashboards so as to allow detailed low level LoB metrics in the underlying BI systems to be used in calculating higher level enterprise key performance indicators in performance management scorecards and dashboards. This is essentially an aggregation pattern. There are two options associated with this pattern. The first is to map the data structures in multiple underlying BI system data stores to the virtual view(s) needed by performance management
Pattern Diagram (Option 1)
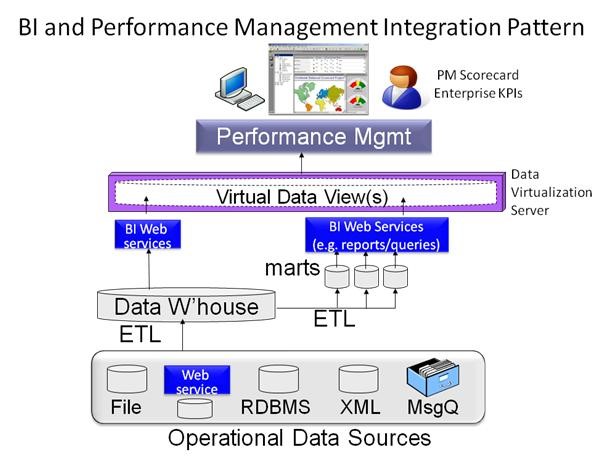
The second is to map the virtual view(s) to underlying BI web services that will retrieve the necessary data from the BI systems as required. These BI web services will typically be BI tool reports and queries published as web services on the BI platform being used. The data virtualization server simply calls the appropriate BI tool(s) via a web service interface to run the report/query to get the data needed to calculate key performance indicators (KPIs) that appear in the performance management scorecard(s).
Pattern Diagram (Option 2)
Pattern Example Use Case
A manufacturer with different lines of business may want to monitor the total cost of shrinkage over all product lines to compare against targets. A bank may have different BI systems monitoring risk exposure for each of its product lines (e.g. mortgages, credit cards, loans) and wants to monitor corporate exposure across all product lines to see if exposure is in line with targets.
Reasons For Using It
Many companies with multiple line of business (LoB) BI systems cannot answer enterprise level questions. This requires enterprise key performance indicators to be calculated by aggregating LoB metrics in multiple BI systems.
In my next blog we will look at the Data Discovery pattern.
Register for additional content
Register today for additional and exclusive content - informative research papers, product reviews, industry news.